

Buyers are still out there. Fewer of them are signing contracts than at any point this year.
Pending sales across the North Texas MLS came in at 902 last week, the first week under 1,000 in 2026. The last four weeks are the four lowest of the year. Over those four weeks, pending sales averaged 982 a week. In the spring, they averaged 2,014.
A single week can wobble, so this week I’m leaning on four-week averages. They tell the same story. The four-week average for pending sales has fallen nine weeks in a row.
Fewer new deals are starting
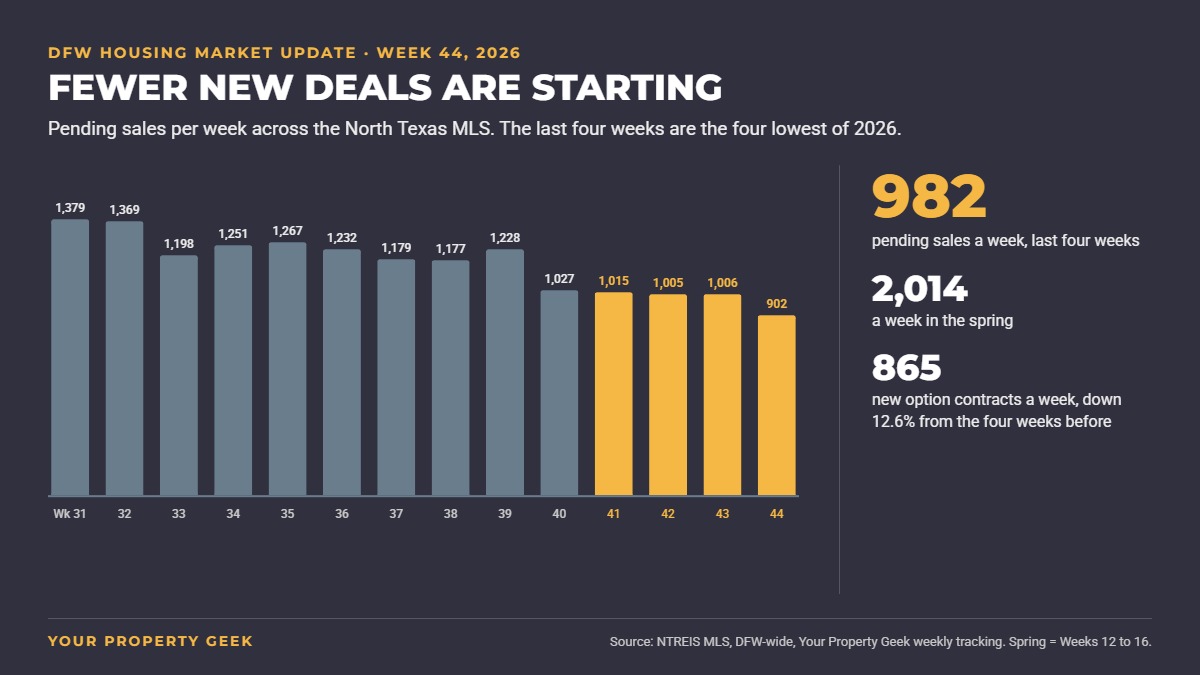
Option contracts, the first step of a Texas home sale, averaged 865 a week over the last four weeks. That’s down 12.6% from the four weeks before, and 37% below the spring.
In other words, the pipeline isn’t refilling. Closings averaged 1,148 a week, down 9.2%, and with fewer contracts behind them, expect closings to keep sliding into November.
Rates gave buyers a small break. Freddie Mac’s 30-year average dropped to 7.32% on Oct. 22, from 7.40% the week before. A year ago, it was 6.19%. That dip hasn’t shown up in applications yet. In the week ending Oct. 16, the Mortgage Bankers Association’s 30-year rate slipped to 7.41%, and purchase applications still fell 7%. They’re 18% below the same week last year.
Price cuts are holding while new listings shrink
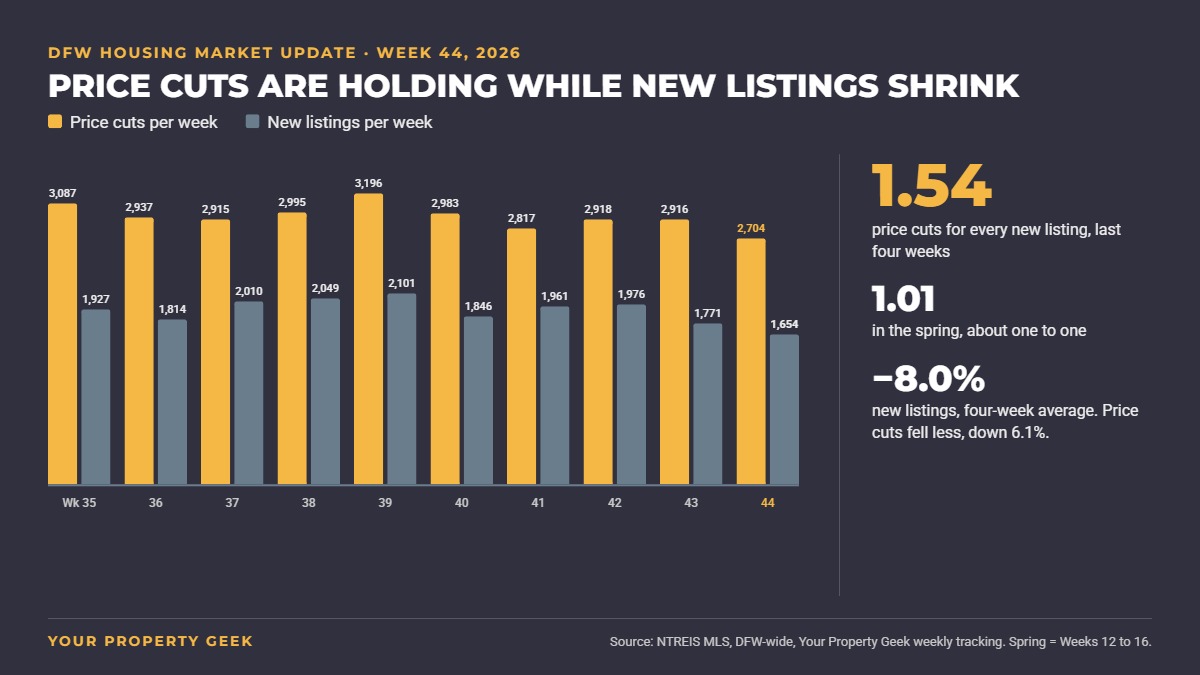
Over the last four weeks, DFW saw 1.54 price cuts for every new listing. That ratio has stayed between 1.51 and 1.58 since late August. In the spring, it ran about one to one.
Sellers aren’t cutting harder. Price cuts averaged 2,839 a week, down 6.1%. New listings fell faster, down 8.0% to 1,841 a week, and last week’s 1,654 was the second-lowest week of 2026.
For you as a buyer, the result is the same either way. For every fresh listing, one and a half homes already on the market got cheaper.
Contracts are holding about as well as before
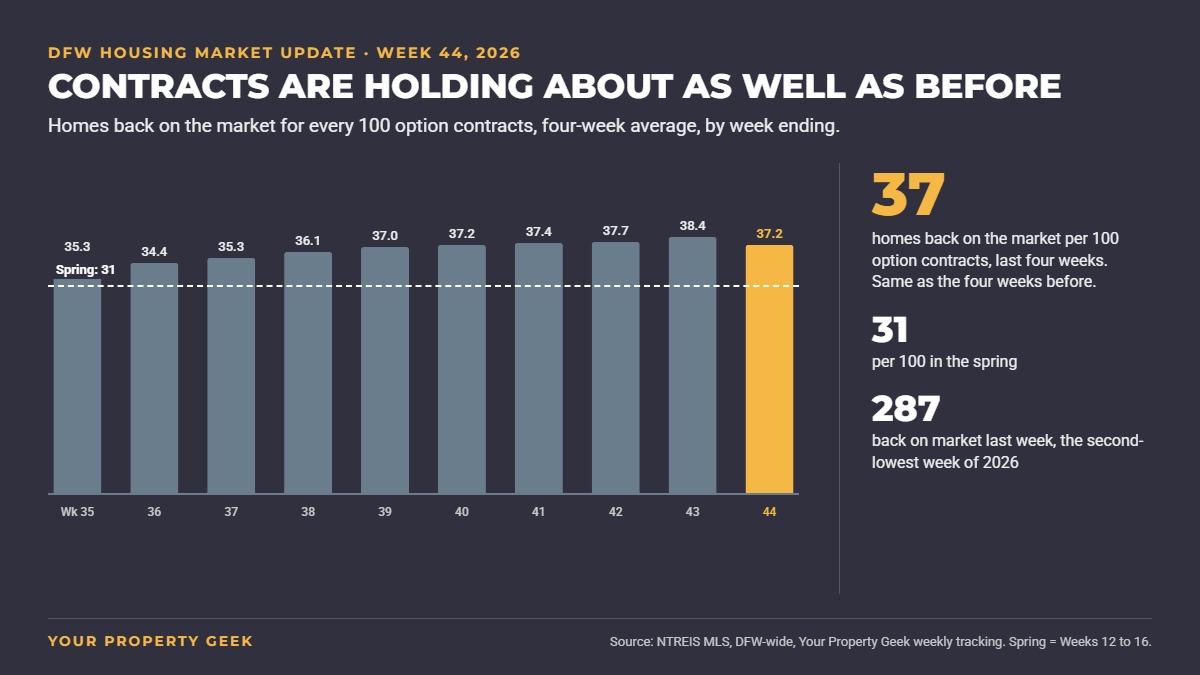
About 37 homes came back on the market for every 100 that went under option over the last four weeks. That’s the same as the four weeks before, and up from 31 in the spring.
Last week looked better on its own, with 287 homes back on the market, the second-lowest week of 2026. One good week is a blip until a second one confirms it.
Fewer listings are making it to the closing table
Over the last four weeks, there were 88 expired or canceled listings for every 100 closings. That’s the highest four-week reading of 2026. In the spring, it was 37.
The number of sellers quitting didn’t jump. Cancellations actually fell 8.4%, to 642 a week. The ratio climbed because closings fell. Put plainly, about as many sellers are giving up as before, and fewer are crossing the finish line.
What this means if you’re buying
You have less competition than at any point this year. With pending sales at a 2026 low, the seller of the house you like most likely isn’t juggling other offers. Ask for the repairs, the closing costs, or a rate buydown.
The rate dip helps, but 7.32% is still high. If you’re stuck deciding whether to wait for rates to fall, here’s how I’d think through buying now vs. waiting for rates to drop. If the payment fits your budget today, write an offer that asks for everything you need.
What this means if you’re selling
Every buyer who walks through your house counts more right now. There are fewer of them, and each one is comparing your home with the 2,704 homes that cut their price last week. Price against today’s competition from day one, so you aren’t chasing the market down.
If you don’t need to move before spring, pause and run the numbers on waiting. If you do need to sell this fall, keep taking backup offers through the option period, because more than one in three contracts still comes back.
The honest caveat
These are DFW-wide numbers. They come from the North Texas MLS (NTREIS) and cover the whole metro, not just North Fort Worth, Haslet, Keller, and Saginaw.
“Back on market” isn’t a perfect measure of broken contracts. It also counts listings returning from a hold, so it slightly overstates how many deals fell apart.
Some of this is the season. Fewer people buy and sell heading into the holidays. This tracking started in January, so I can’t yet show you how this October compares with last October. That comparison starts next year.
For last week’s numbers, read the Week 43 DFW housing market update.
Frequently asked questions
Why are fewer homes going under contract in DFW?
High rates and the season. The 30-year average is 7.32%, more than a full point above a year ago, and fewer people buy heading into the holidays. Pending sales across the North Texas MLS fell to 902 last week, the lowest of 2026.
Is fall a good time to buy a house in DFW?
It can be. Pending sales are at their 2026 low, so you face less competition and have more room to negotiate. If the payment fits your budget, ask the seller for concessions.
Are more home sales falling through in DFW?
Not more than in recent weeks. About 37 homes came back on the market for every 100 that went under option over the last four weeks, steady since late August but above the spring rate of 31. If a home you like came back on the market, ask the listing agent why.
Are DFW sellers giving up?
Relative to sales, yes. There were 88 expired or canceled listings for every 100 closings over the last four weeks, up from 37 in the spring. Cancellations actually fell, though, so the ratio is rising mainly because fewer homes are closing.
Want a current number on your place? Start here.
Data notes: Weekly counts from the North Texas Real Estate Information Systems (NTREIS) MLS, DFW-wide, Week 44 of 2026, from Your Property Geek’s weekly tracking. “Last four weeks” is Weeks 41 to 44, compared with Weeks 37 to 40. “Spring” is Weeks 12, 13, 14, and 16 (mid-March to mid-April, no Week 15 in the tracking). Four-week ratios divide the four-week totals. Price-cut and back-on-market ranges cover four-week windows ending Weeks 35 to 44. Failed listings are expired plus canceled. Sources: Freddie Mac PMMS, Oct. 22, 2026, MBA Weekly Survey, week ending Oct. 16, 2026.